Application Performance Monitoring
Application Performance Monitoring has gotten complicated with all the metrics, tools, and distributed architectures flying around. As someone who’s managed web applications and monitored performance for small businesses for years, I learned everything there is to know about keeping applications running smoothly without drowning in data. Today, I will share it all with you.

What is Application Performance Monitoring?
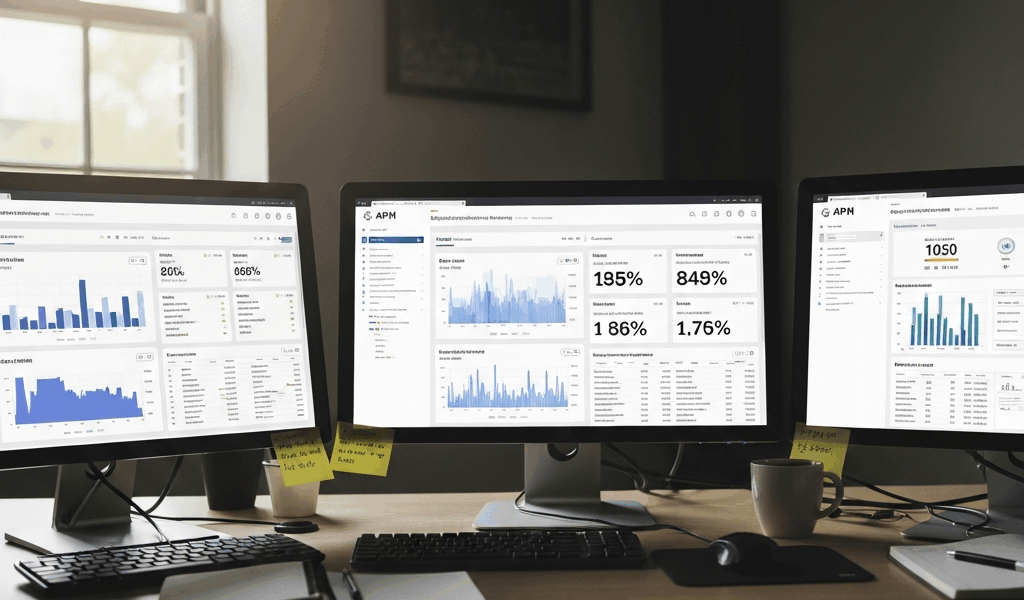
APM involves tools and processes that monitor how your applications perform in production. You track response times, transaction rates, error rates, and system health. The goal is catching and fixing performance problems before users complain or leave. It’s the difference between knowing your app is slow and understanding exactly why it’s slow.
Why APM is Important
Applications power critical business operations. When they’re slow or down, you lose money, damage your reputation, and frustrate customers. I’ve watched small businesses lose sales during performance issues that could have been prevented with proper monitoring. APM helps by:
- Enhancing user experience by keeping applications fast and responsive. Users expect sub-second page loads; anything slower and they bounce.
- Identifying bottlenecks in real-time. Is it the database? The API? The frontend? APM tells you exactly where problems are.
- Reducing downtime by predicting issues before they cause outages. Proactive alerts beat reactive firefighting every time.
- Supporting continuous improvement through data-driven decisions. You optimize what you measure.
Key Components of APM
Probably should have led with this section, honestly. APM tools focus on several core areas that together give you complete visibility:
- End-User Experience Monitoring (EUEM): Measures performance from your users’ perspective—what they actually experience, not what your servers report.
- Runtime Application Architecture: Maps how application components interact in real time. Shows dependencies and data flow.
- Business Transactions: Tracks specific workflows that matter to your business—checkout processes, user signups, report generation.
- Component Deep-Dive Monitoring: Examines individual components like databases, web servers, APIs, and third-party services.
- Analytics: Aggregates data from all sources to provide actionable insights and predictions.
End-User Experience Monitoring (EUEM)
EUEM captures how real users experience your application. It tracks page load times, JavaScript errors, transaction failures, and user satisfaction. This data reveals the gap between what you think users experience and what they actually experience. I’ve seen applications that ran perfectly in testing but had terrible real-world performance due to network conditions, device variations, and user behavior patterns the development team never anticipated.
Runtime Application Architecture
Modern applications consist of multiple interconnected components—web servers, application servers, databases, caching layers, APIs, third-party services. Runtime architecture mapping visualizes these connections and shows how data flows through your system. When performance degrades, this map helps you identify which component or connection is the problem. Without it, you’re guessing.
Monitoring Business Transactions
Business transaction monitoring tracks specific workflows critical to your operation. For e-commerce, that’s the checkout process. For SaaS applications, it’s user authentication and key feature usage. You monitor these transactions end-to-end from the moment a user initiates them through all backend processing to final completion. This helps pinpoint exactly where in a multi-step process things break down.
Component Deep-Dive Monitoring
Deep-dive monitoring examines individual components in detail. Database queries, web server response times, API call latency, memory usage, CPU utilization. When overall performance degrades, component monitoring tells you which specific piece is struggling. I typically find the problem is either database queries that need optimization or external API calls that are suddenly slow.
Analytics in APM
APM tools collect massive amounts of data—logs, metrics, traces from every component. Analytics processes this data into useful insights. Modern APM tools use machine learning to establish baselines, detect anomalies, and predict potential issues before they cause outages. The best analytics identify patterns like “every Tuesday at 2 PM, this API slows down” that humans would miss in the noise.
Popular APM Tools
Several APM tools dominate the market, each with different strengths:
- New Relic: Comprehensive monitoring for frontend and backend with good visualizations. User-friendly but can get expensive at scale.
- AppDynamics: Strong business transaction monitoring with deep insights into user journeys. Enterprise-focused with enterprise pricing.
- Dynatrace: AI-driven automation that reduces manual configuration. Excellent for complex environments but has a learning curve.
- SolarWinds: Known for infrastructure monitoring, decent APM capabilities, more affordable than enterprise options.
- Datadog: Combines server monitoring, APM, and log management in one platform. Great for teams that want everything integrated.
Implementing APM
That’s what makes APM endearing to us developers and business owners—when implemented correctly, it prevents the 3 AM emergency calls about the site being down. Here’s how to implement it properly:
- Define Goals: Know what you want to achieve. Reduce checkout abandonment? Improve API response times? Support more concurrent users? Clear goals guide tool selection and configuration.
- Select Tools: Choose APM tools that match your technology stack and budget. Not every business needs enterprise APM; some work fine with simpler solutions.
- Instrument Applications: Integrate APM tools into your applications. This typically means installing agents on servers or adding SDKs to your code. Some tools require minimal setup; others need extensive configuration.
- Configure Monitoring: Set up dashboards showing key metrics, alerts for critical thresholds, and reports for stakeholders. I configure alerts carefully to avoid alert fatigue—too many false alarms and people ignore them.
- Analyze Data: Regularly review performance data to identify trends and address issues before they become critical. Weekly reviews work for most small businesses.
- Iterate and Optimize: Continuously refine monitoring based on what you learn. Add monitoring for new features, remove monitoring for deprecated ones, adjust alert thresholds based on experience.
Challenges in APM
APM implementation comes with real challenges that can derail efforts if you’re not prepared:
- Complexity: Modern distributed architectures with microservices, containers, and serverless functions are difficult to monitor comprehensively. Too many moving pieces.
- Data Overload: APM tools can generate overwhelming amounts of data. Focus on actionable metrics that drive decisions, not vanity metrics that look impressive but mean nothing.
- Integration: Getting APM tools to work with existing systems, workflows, and alert systems can be challenging. Plan integration time into your implementation schedule.
- Cost: Effective APM solutions aren’t cheap, especially at scale. Balance cost against the value of avoiding downtime and improving user experience.
APM Best Practices
To maximize APM benefits, follow these practices learned from real-world implementations:
- Understand Your Architecture: You can’t monitor what you don’t understand. Document your application architecture and dependencies before implementing APM.
- Measure End-User Experience: Server metrics are useful, but user experience is what actually matters. Prioritize monitoring from the user’s perspective.
- Set Realistic Thresholds: Alert thresholds should reflect actual business impact, not arbitrary numbers. A 500ms API response might be fine for some endpoints, critical for others.
- Automate: Use automation for routine monitoring, alerting, and even some remediation. Automated restarts for stuck processes can fix issues before humans notice.
- Keep It Simple: Focus on key metrics that drive decisions. Don’t monitor everything just because you can. Too much monitoring creates noise that obscures real problems.
Future of APM
APM is evolving rapidly with AI and machine learning capabilities. Future tools will offer better predictive capabilities—forecasting problems days in advance instead of minutes. Automated remediation will become more sophisticated, fixing common issues without human intervention. Integration with DevOps workflows will deepen, making APM an integral part of the entire software lifecycle from development through production. The trend is toward APM that requires less manual configuration and provides more actionable insights automatically. For small businesses, this means powerful monitoring capabilities will become more accessible and affordable over time.


Stay in the loop
Get the latest web sme updates delivered to your inbox.